
☰ Menu
Menu
August was a quieter month than July. Fewer homes came on the market, fewer went under contract and fewer closed.
Measured against last August, the same month looks stronger. Closings were up 9.6 percent. The median sale price was up 2.0 percent. Homes sold faster than they did a year ago.
Both readings are accurate, and the question we keep getting is which one to believe heading into fall. The answer depends on which side of the Asheville real estate market you are on.
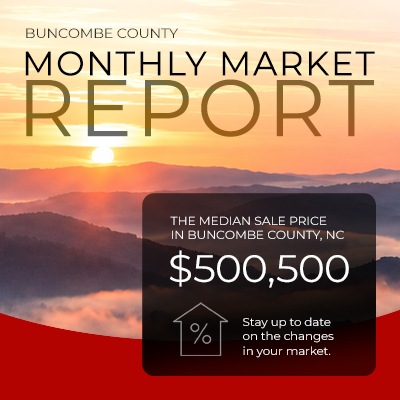
Here is where things landed. Buncombe County closed 320 single-family sales in August at a median price of $500,500. There were 1,790 active listings, which works out to 5.6 months of supply. The median home sold in 45 days for 94.9 percent of its original list price.
Troy spent 20 years as a state-certified appraiser before focusing full time on brokerage, so this office does not stop at the median. The useful part of this report sits one layer down, in how the homes that sold quickly differed from the ones that did not. Below is how each piece reads from the buyer’s side and the seller’s.
The median sale price rose $16,255 from July’s $484,245, a 3.4 percent gain in one month. Against last August’s $490,563, it is up $9,937, or 2.0 percent.
We would not read much into the monthly jump. A one-month median moves with the mix of homes that happened to close, and August closed 40 fewer than July. The yearly figure is the steadier one, and 2.0 percent is modest growth.
The number underneath it is concessions. Of the homes that sold in August, 45.0 percent included seller concessions, compared with 45.8 percent in July and 41.8 percent a year ago. The median concession was $7,500. It was $6,000 in July and $5,000 last August.
So over the past year, the median sale price went up $9,937 while the median check back to the buyer grew by $2,500.
For buyers, asking for help with closing costs or a rate buydown is an ordinary request this fall. Nearly half of sellers agreed to one last month. For sellers, the price you accept and the amount you walk away with are drifting further apart. Know both numbers before you sign.
Active listings slipped 1.6 percent from July, from 1,819 to 1,790. Against last August’s 1,703, they are up 5.1 percent. Buyers have more to choose from than they did a year ago and about the same as a month ago.
Months of supply rose from 5.1 in July to 5.6 in August. The active count barely moved while closings fell, so the increase reflects slower sales rather than a wave of new listings. A year ago the figure was 5.8, which makes this August slightly tighter than last.
A supply figure near six months is generally read as balanced. Buncombe County is close to it and has been for most of the year.
New listings fell 9.7 percent from July, from 506 to 457, and 3.4 percent from last August’s 473. Fewer sellers listing in late summer is common once school starts.
Pending sales dropped 6.1 percent from July, from 459 to 431. Against last August, they are exactly flat at 431. Closings fell 11.1 percent from July’s 360 but rose 9.6 percent over last August’s 292.
The pending ratio, the share of active listings under contract, came in at 19.4 percent. That is down from 20.1 percent in July and 20.2 percent a year ago. Roughly one home in five on the market was under contract.
Pendings are the number we watch most closely heading into fall, because they become September and October closings. Flat against last year tells us buyer demand has held. It has not grown to meet the extra inventory.
Median days on market was 45, down from 52 in July and 49 last August. Most reports stop there. That single figure blends two very different groups of sellers.
Just over half of the homes that sold in August, 50.3 percent, took at least one price reduction. Those homes had a median of 111 days on market and sold for 89.2 percent of their original list price. The homes that never cut their price went under contract in a median of 11 days and sold for 97.9 percent of original list.
On a home originally listed at $500,000, that is the difference between selling for about $489,500 and about $446,000. The gap is $43,500, plus roughly three extra months of mortgage payments, taxes, insurance and utilities.
The year-over-year comparison makes the point sharper. Homes priced right the first time are moving about as fast as ever: 11 days, against 12 in July and 10 last August. Reduced homes took a median of 111 days, better than July’s 140 but well behind last August’s 94. The typical cut was 6.8 percent, down from 8.5 percent in July and 7.7 percent a year ago. On a $500,000 list price, 6.8 percent is $34,000.
We would not list above the comparable sales this fall with a plan to come down later. The data says that plan costs more than it saves.
For buyers, the reduced homes are where the negotiating room is. A house at day 90 with one cut behind it is a different conversation than one listed last week. Ask how long it has actually been available, because a relisted home can show a fresh day count online.
The share of homes selling at or above list price fell to 15.9 percent, from 17.8 percent in July and 17.1 percent last August. That is roughly one sale in six.
The median sale-to-original-list ratio moved the other way, up to 94.9 percent from 93.5 percent in July and 93.7 percent a year ago. There were fewer competitive offers, but the typical discount was smaller. That fits the split above. Fewer sellers had to cut their price, 50.3 percent compared with 53.6 percent in July and 54.1 percent last August, so more sales landed near their original number.
The last line on the report is the least flattering one. Of the listings that left the market in August, 33.9 percent failed, meaning they expired or were withdrawn without selling. That is up from 29.3 percent in July and 30.1 percent last August. In our experience, most of those trace back to the first price.
Buncombe County slowed a little from July and held up well against last year. Prices are up modestly over twelve months. Inventory is up 5.1 percent, and more sellers are covering buyer costs at closing than a year ago.
So which way does fall tip? We would not be surprised to see pendings soften further as the season goes on, but the supply numbers do not point to a buyer’s market this year. We will know more once the October numbers come in.
None of this tells you what your house would do. A renovated bungalow in West Asheville and a ridge lot outside Black Mountain on well and septic sell to different buyers on different timelines, and the county median blends them together.
If you are thinking about selling, reply with your address or call Troy Flack Group at (828) 275-7275. We will pull the sales that actually compare to your home and tell you where we would price it. No cost and no obligation to list. If you are buying, we will show you which of the reduced homes still have room in them.
We would rather you price it right once than spend a season chasing the market down.
Troy Flack Group | Keller Williams Professionals | 828-275-7275 | troyflackgroup.com